.png)
A couple of months ago, I ran into an interesting problem. My fiancée is a veterinarian, and she was working on a research project looking to evaluate the effects of a new type of anesthetic during surgeries on dogs. The problem was that after the trials were over, she had to analyze and process the massive amount of data collected.
To make matters difficult, the data for each patient was recorded on a paper-style sheet that was later sent over as a PDF, so about as unstructured as you could get (Well, at least all the data was typed and not handwritten). On top of that, the sheet templates were not consistent across different trial dates and had slight variations across them.
This was complex and multidimensional data. Each patient record combined timestamped medications and dosages given during surgery, timestamps for different steps and important milestones, clinical remarks, and vitals such as heart rate, blood pressure, and respiration recorded throughout the procedure.
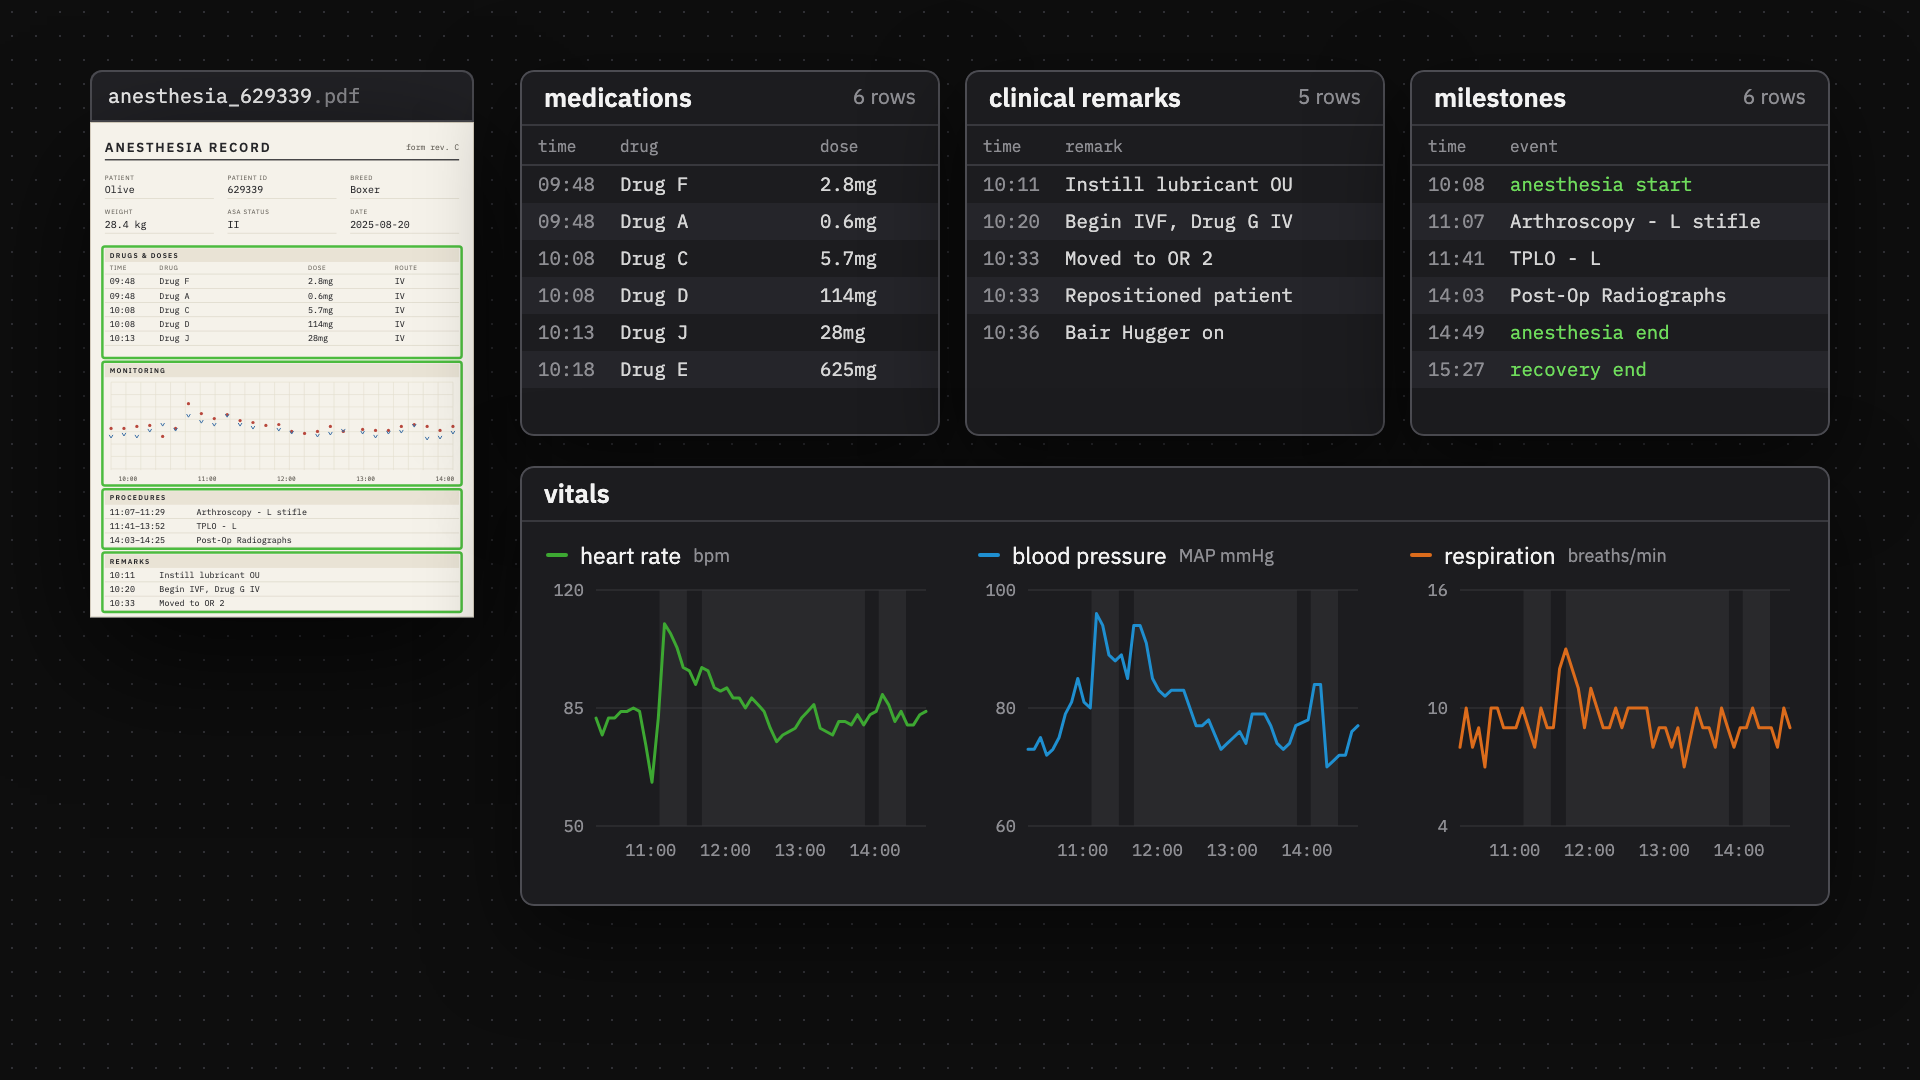
Even if we could get all the data out of these PDFs, it wasn’t going to fit nicely into something like a single excel file. We needed to bring in some heavy artillery.
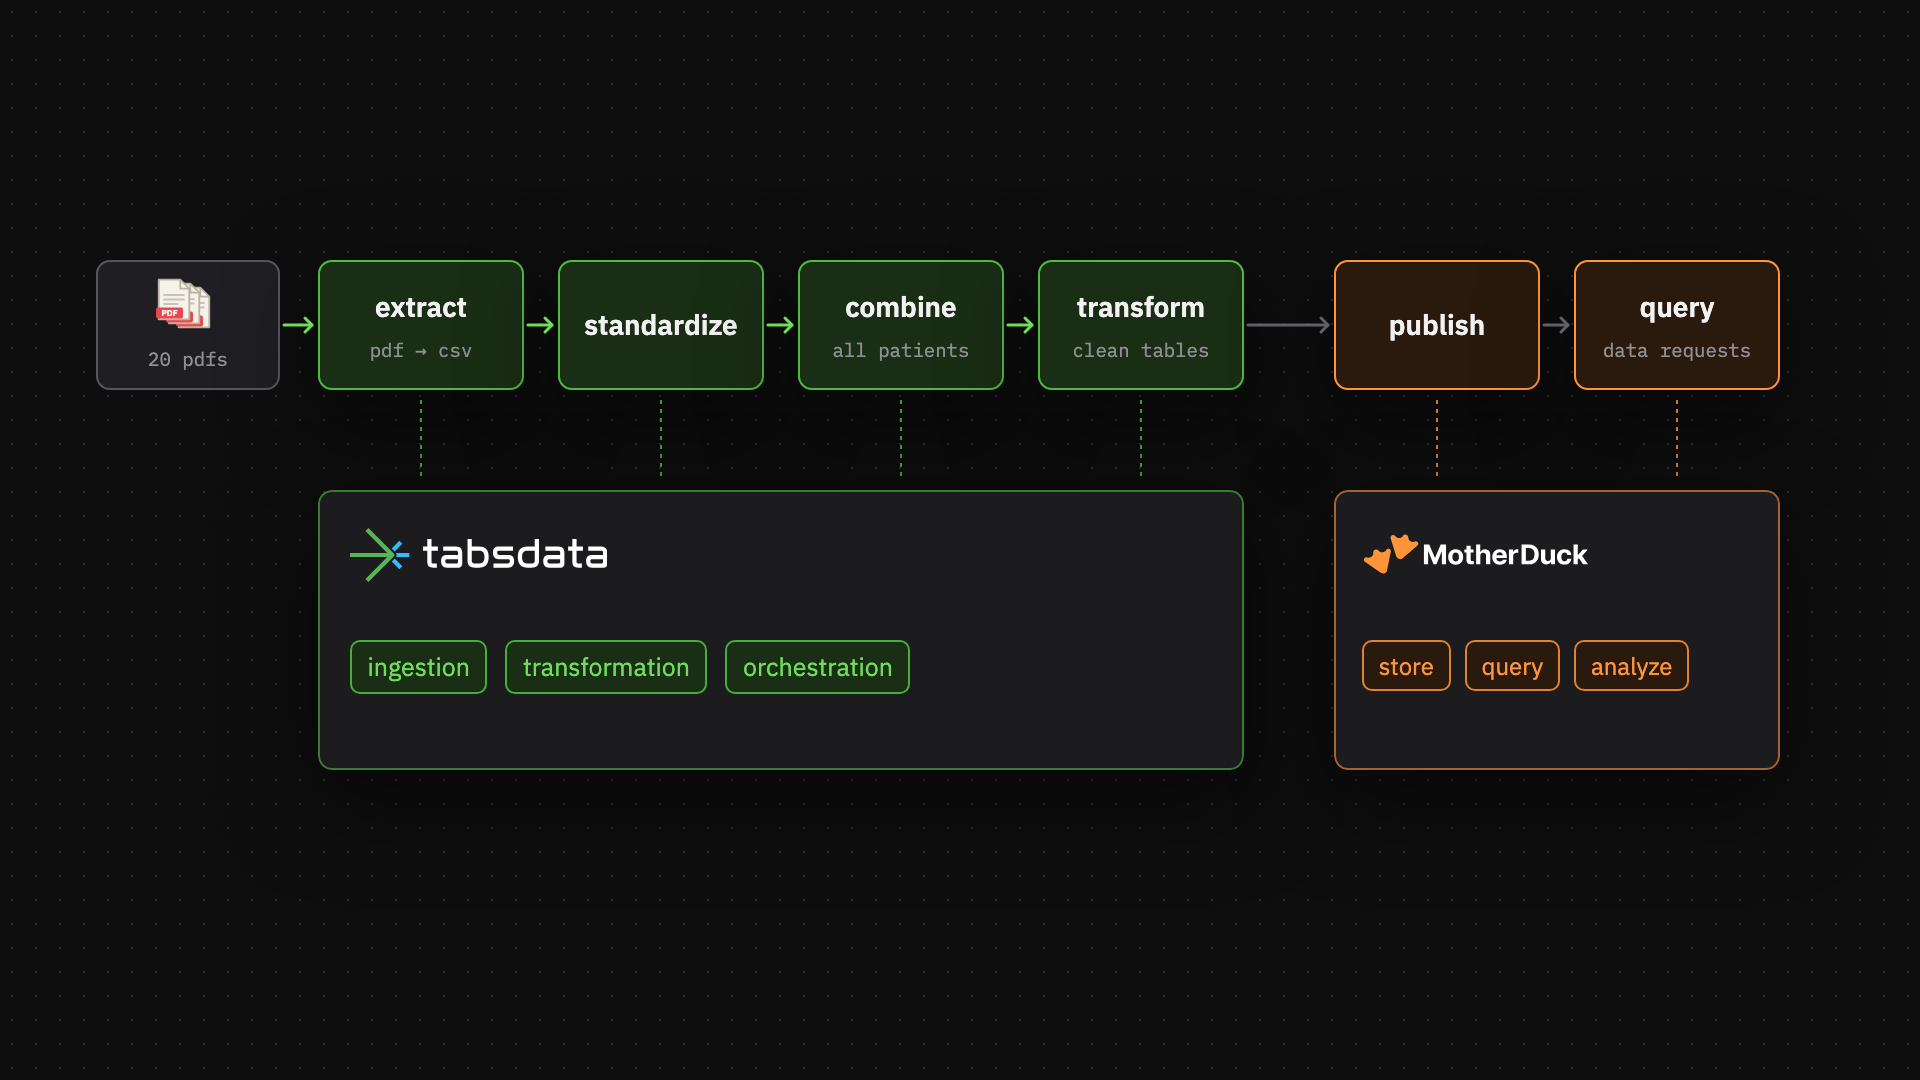
I needed something that could ingest all of these files, combine them, clean and standardize the data, deduplicate records, and transform everything into a structure that was actually useful for analysis. I also wanted the workflow to be flexible enough to work as either a one-time migration or something we could run again whenever new trial data came in.
Even if I got the tables into a good shape, I still needed a way to easily share the data and respond quickly to analytical requests from statisticians looking for different slices and subsets of it.
This is why I chose Tabsdata + MotherDuck.
Both tools are lightweight, flexible, quick to set up, and great for analytical workloads. Tabsdata handles Data Ingestion, Transformation, and Orchestration while MotherDuck handles storage, querying, and analytics.
Prepping My Data
Before I started building anything, I needed to get the data out of the PDFs.
I first extracted the text from each PDF into a .txt file. I then used an LLM to parse that text and identify a loose schema of the fields that appeared across the different patient records.
Using those fields, I designed a star schema skeleton for how I wanted the final data to be organized. I then had the LLM parse the unstructured text from each patient and convert it into a set of CSVs that roughly matched that structure.
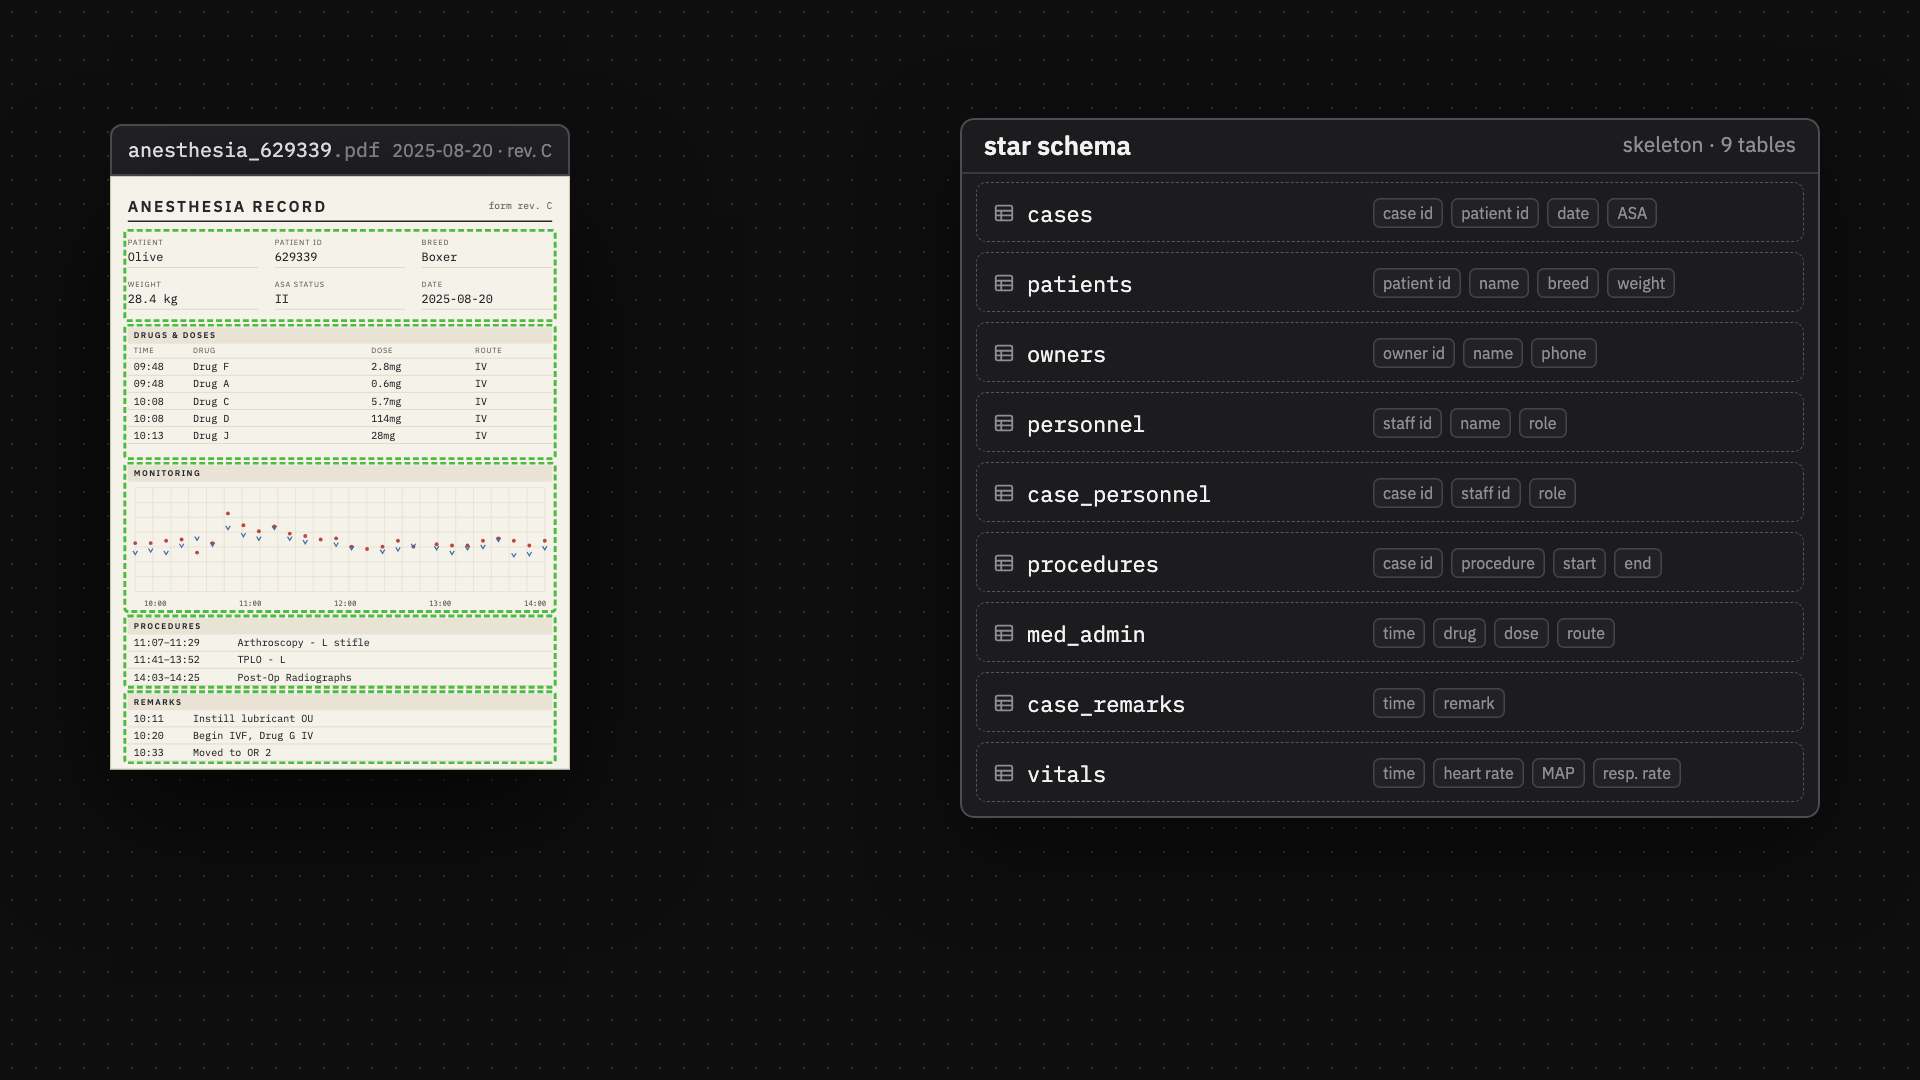
This was the only time I used an LLM on its own to do data transformation in this project. The processing the LLM did was non-deterministic and prone to errors, but it did a lot of the grunt work in getting us like 80% of the way. I still had to manually walk through a lot of the generated CSVs and correct missed values, formatting issues, and other inconsistencies.
Tabsdata
At this point, I had a couple of problems.
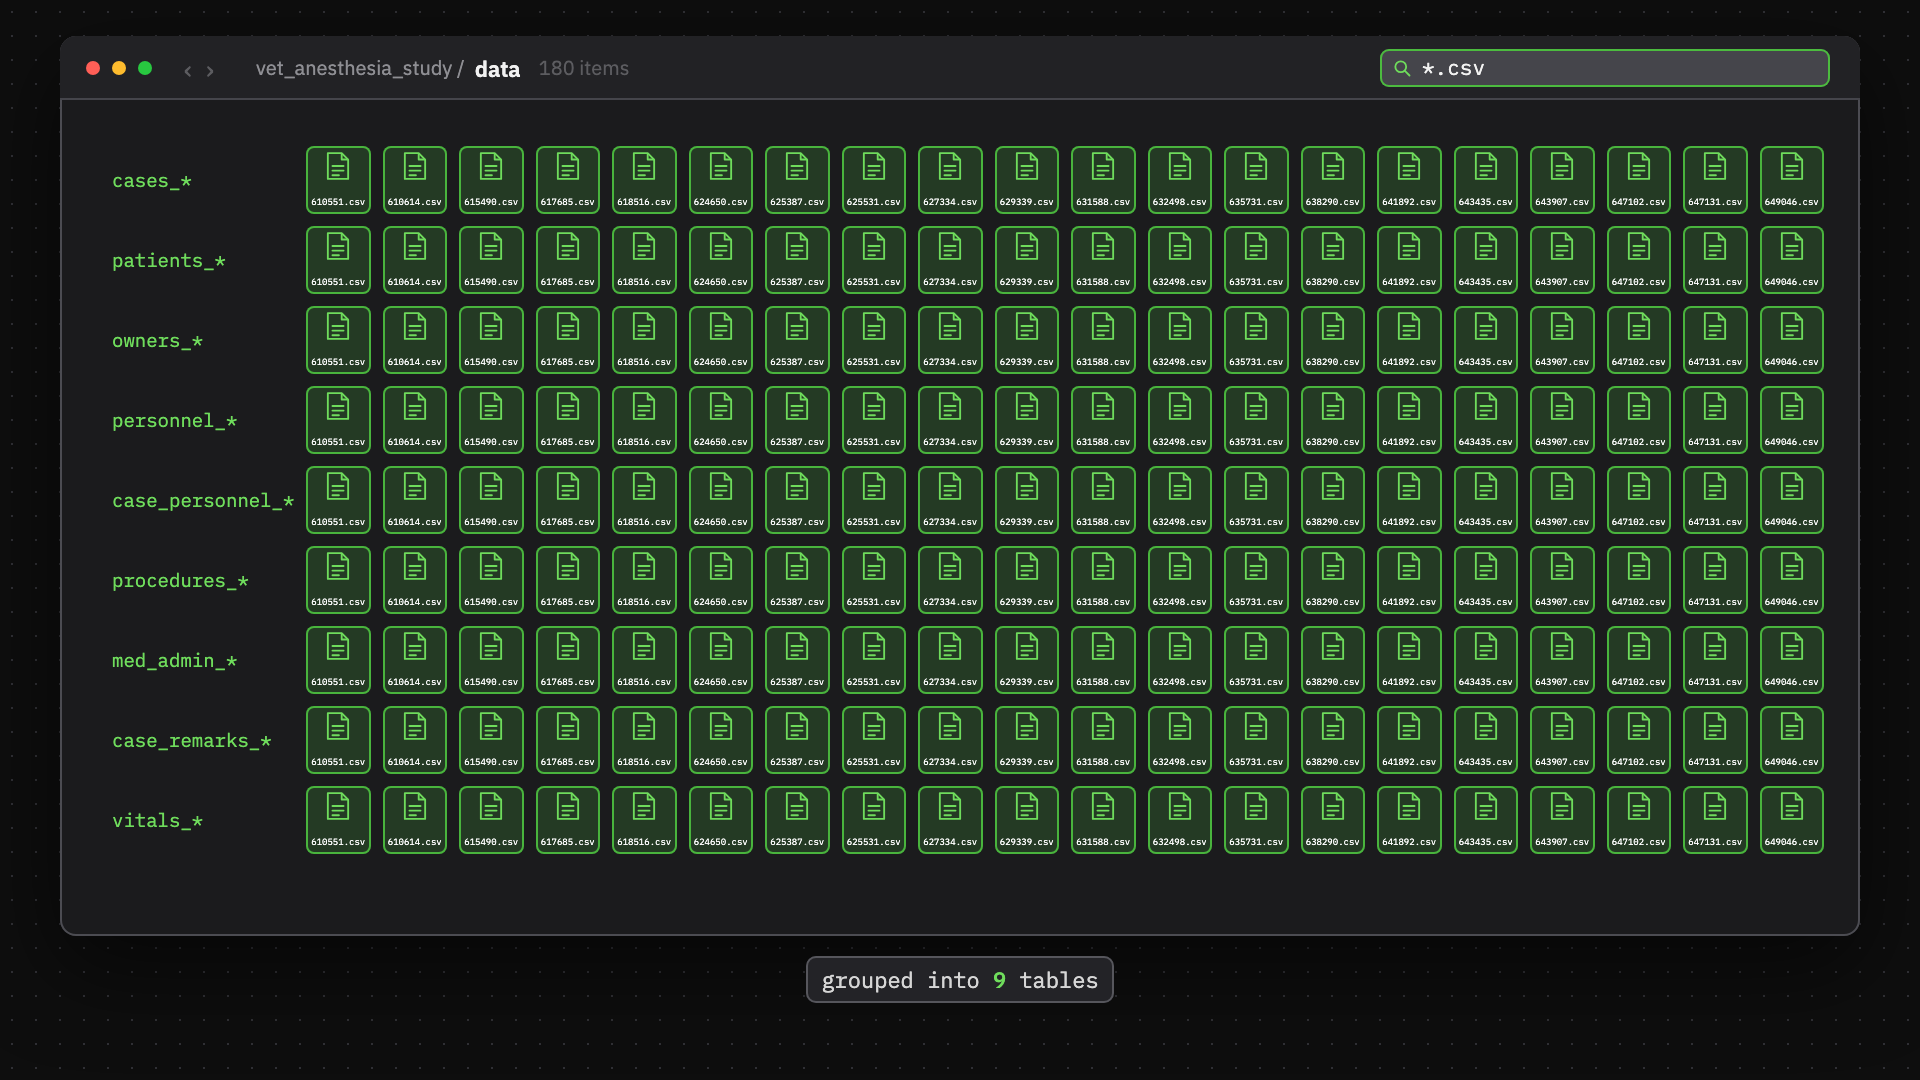
First off, I had almost 180 CSV files!
Each type of dataset I wanted to analyze was spread across many CSVs, generally with one file per animal. For example, instead of having one table containing vitals for every patient, I had separate vitals files for each individual patient.
The data types were also a mess. Somewhere between the original PDFs, text extraction, and CSV generation, values such as integers, floats, booleans, dates, and timestamps had effectively been reduced to strings.
There were also schema mismatches between files. Some patients were missing certain fields entirely, while others had additional columns, which made concatenating all of those files into a single dataset more difficult.
Using Tabsdata, I created a workflow that wildcard-matched all of the CSV files belonging to a particular dataset, aligned their schemas, concatenated them into one dataset, and wrote the result into a versioned Tabsdata Table.
Even better, I set it up so that each execution of the workflow would only pick up newly added files instead of reprocessing everything from scratch. Because the resulting data lived in versioned Tabsdata Tables, I could also track when different batches of data had been added and processed.
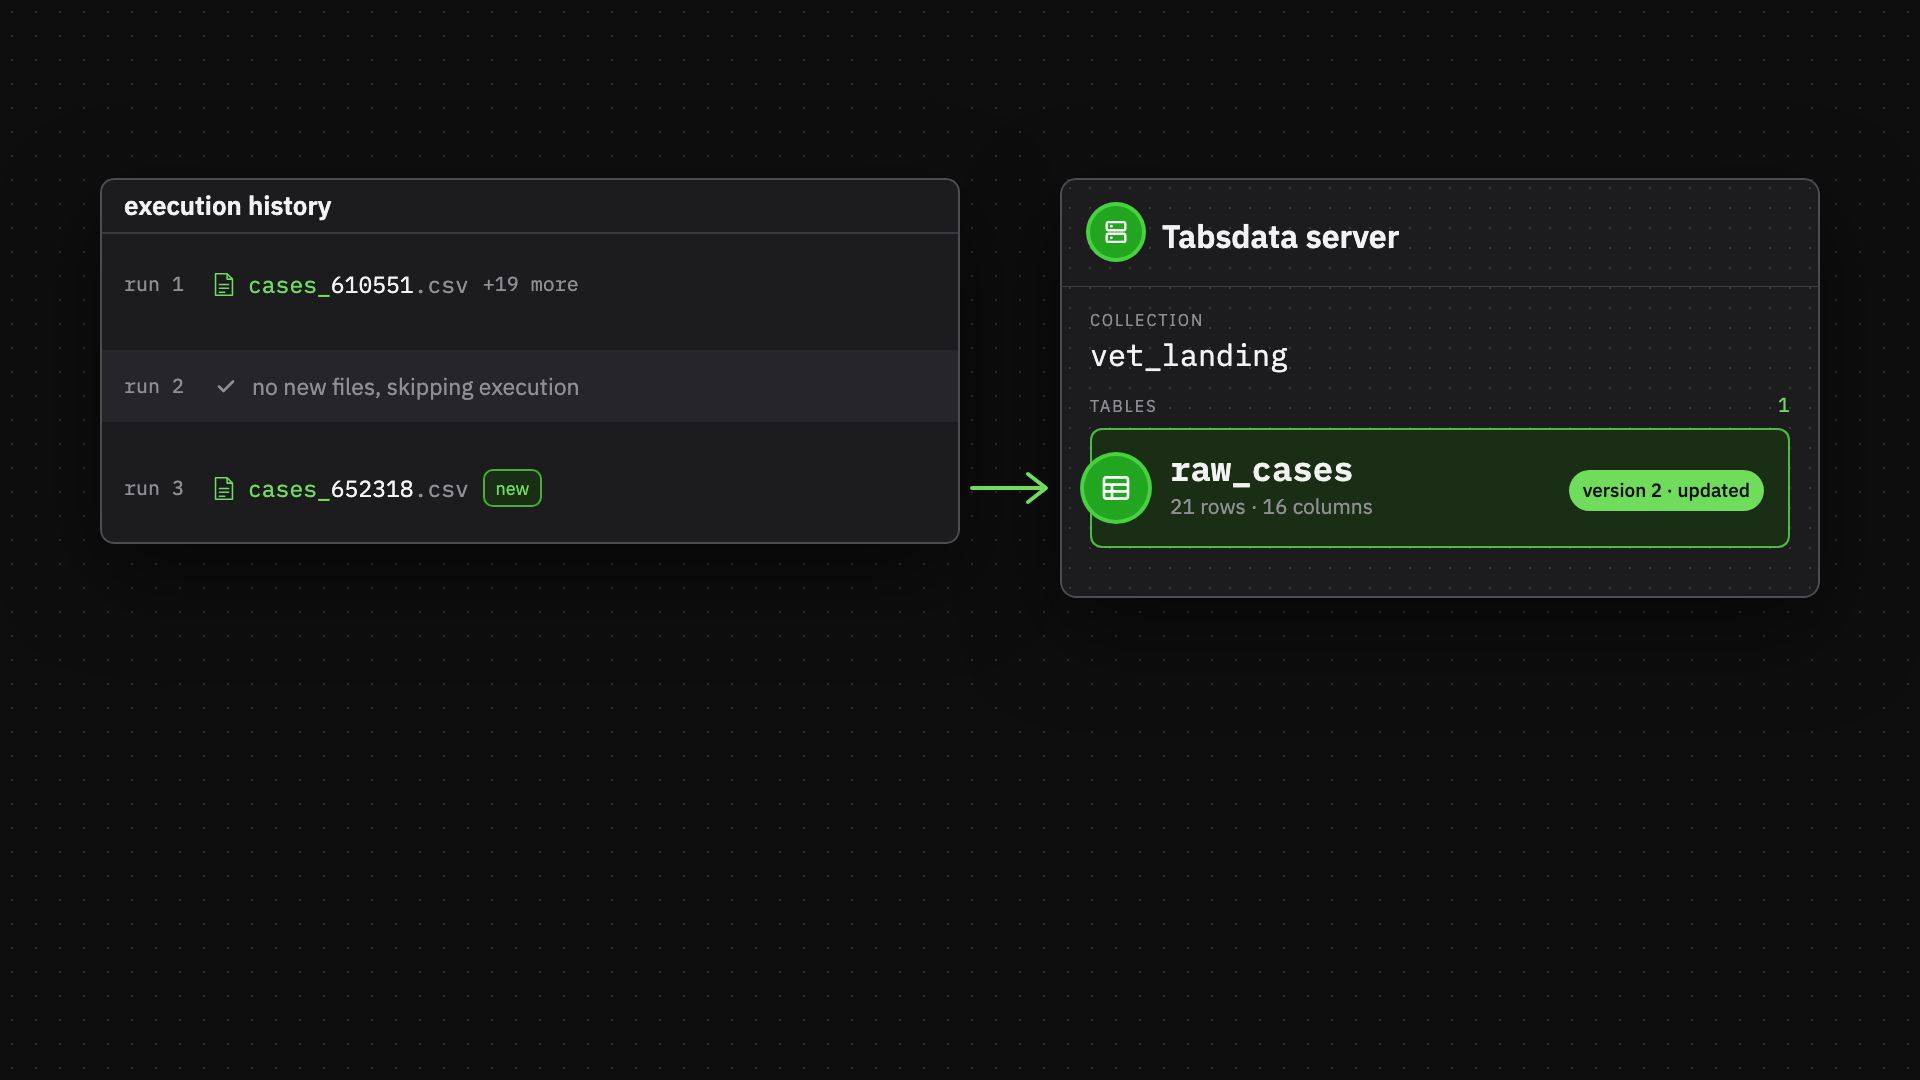
Okay, good. We had our Bronze tables, but the data inside them was still messy.
I then used Tabsdata to build Silver tables from the Bronze layer that handled a few different cleanup steps:
- Fixing data types: Fields that had been turned into strings were cast back into the types they were supposed to represent, including dates, datetimes, integers, floats, and booleans.
- Cleaning up the schema: Column names were standardized to
snake_caseand given a consistent naming convention. The original files contained a mix of camel case, spaces, symbols, and inconsistent naming. - Cleaning up values: Some fields that were supposed to contain numeric values, such as medication dosages, also contained units or extra whitespace. I used regex to separate the numeric value from the unit so each could live in its own column. Blank or inconsistent missing values were also standardized to nulls.
- Deduplicating data: Some dimensional data appeared multiple times across patient files. Those duplicate records were removed before building the final analytical tables.
Our Gold tables then took that cleaned data and joined it together into the fact and dimension tables from the star schema I had designed earlier.
I also created a few Gold tables that rolled up commonly needed metrics, such as counts, totals, and other values that would be useful during analysis.
Building with MCP
I originally built this workflow a few months ago using Tabsdata 1.0, where I hand-coded most of the pipeline myself. Since Tabsdata 2.0 came with an MCP integration, I was able to rebuild the entire workflow in minutes by pointing my LLM at the source data and have it build all my tabsdata functions, motherduck connectors, execute workflows, and debug errors.
So what originally required me to manually build over several days was recreated in minutes.

MotherDuck
With the data cleaned and modeled, I needed somewhere I could remotely publish it, easily share access to it, and run analytical queries whenever we got requests for different slices of the data. MotherDuck fit this need very well and took about 10 minutes for me to get set up.
After that, I built a custom Tabsdata connector for MotherDuck that automatically created the database and relevant tables, then loaded the data from my Tabsdata Tables into them.
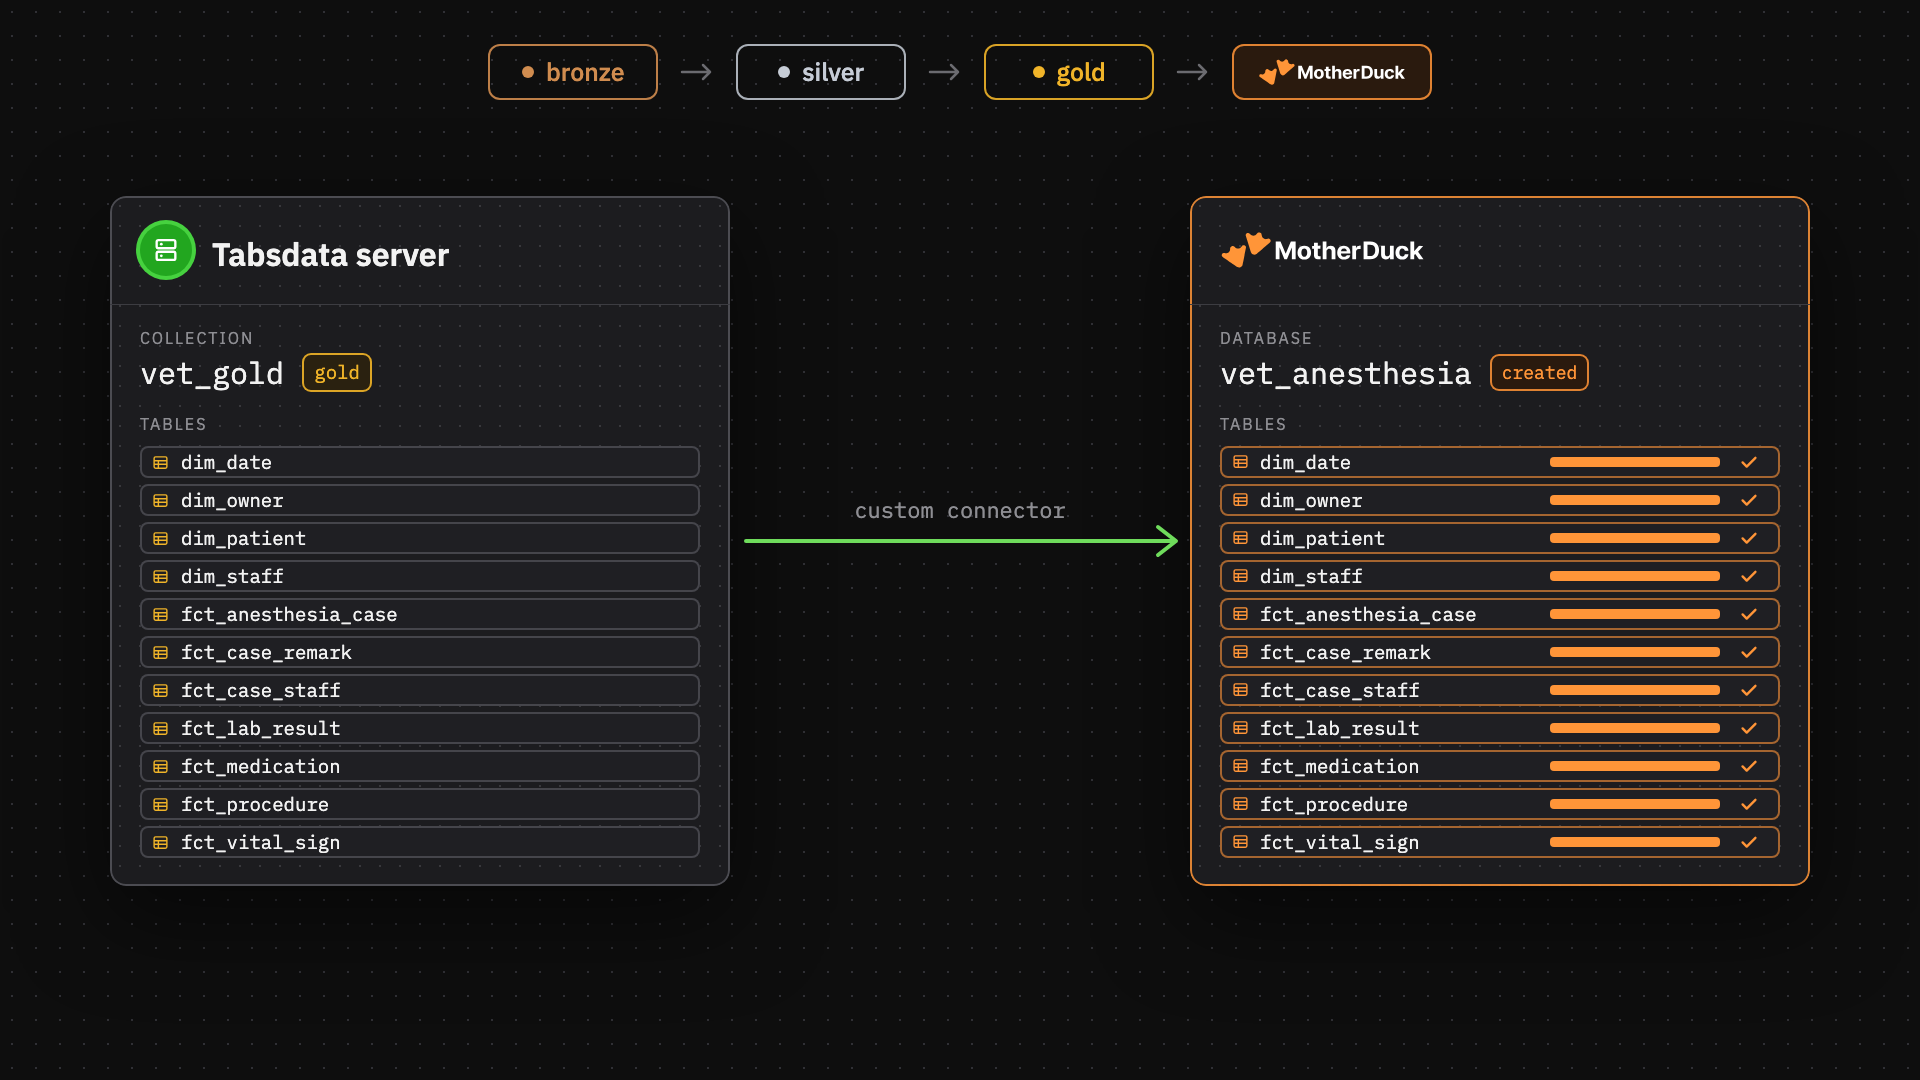
MotherDuck then gave me a really convenient place to work with the final dataset. I could create SQL notebooks, write and run queries, use the built-in AI tools to help debug them, and download the results without having to leave the browser.
So when a statistician needed a new subset or slice of the study data, I didn’t have to go back through the CSVs or create another custom export.
The cleaned and standardized data was already sitting in MotherDuck, ready to query.