Getting data ready for your warehouse. Just ask.
Take an existing use case, built by someone else with no Tabsdata in mind. Point an agent at it and ask for the same thing in Tabsdata. One system, an AI conversation and a couple of hours later, there it is.
Same data, same medallion layers, same dashboards at the end, in the warehouse, where they belong.
The use case
I didn't want to make up a use case from scratch. Anything I built myself would have been shaped around Tabsdata, whether I meant it or not. So I went looking for an existing one; NYC-DATABRICKS fit the bill.
I've picked NYC-DATABRICKS for what it does, functionally: end to end, a realistic need. The use case can be implemented with a better choice of Databricks capabilities and tools (see Implementing the use case in idiomatic Databricks below). This is a port, not a rewrite: same inputs, same layers, same gold contract, same three dashboards.
Every month the NYC Taxi & Limousine Commission publishes every green-taxi trip: when and where it started and ended, the distance, the fare, the tip. The project turns those files into answers for fleet managers (where is demand, which zones are underserved), finance (revenue, tips, fares that look off) and compliance (service coverage; invalid, reversed or duplicated records). A medallion lakehouse on Databricks, and one dashboard per audience.
It is not about Tabsdata instead of the warehouse. The SQL, the analytics and the dashboards are what a warehouse is great at, and they stay there. The question is the part before that, getting the data in and getting it ready, which doesn't have to happen inside the warehouse and may not be the best use of it. Right tool for the right job.
Use case current implementation
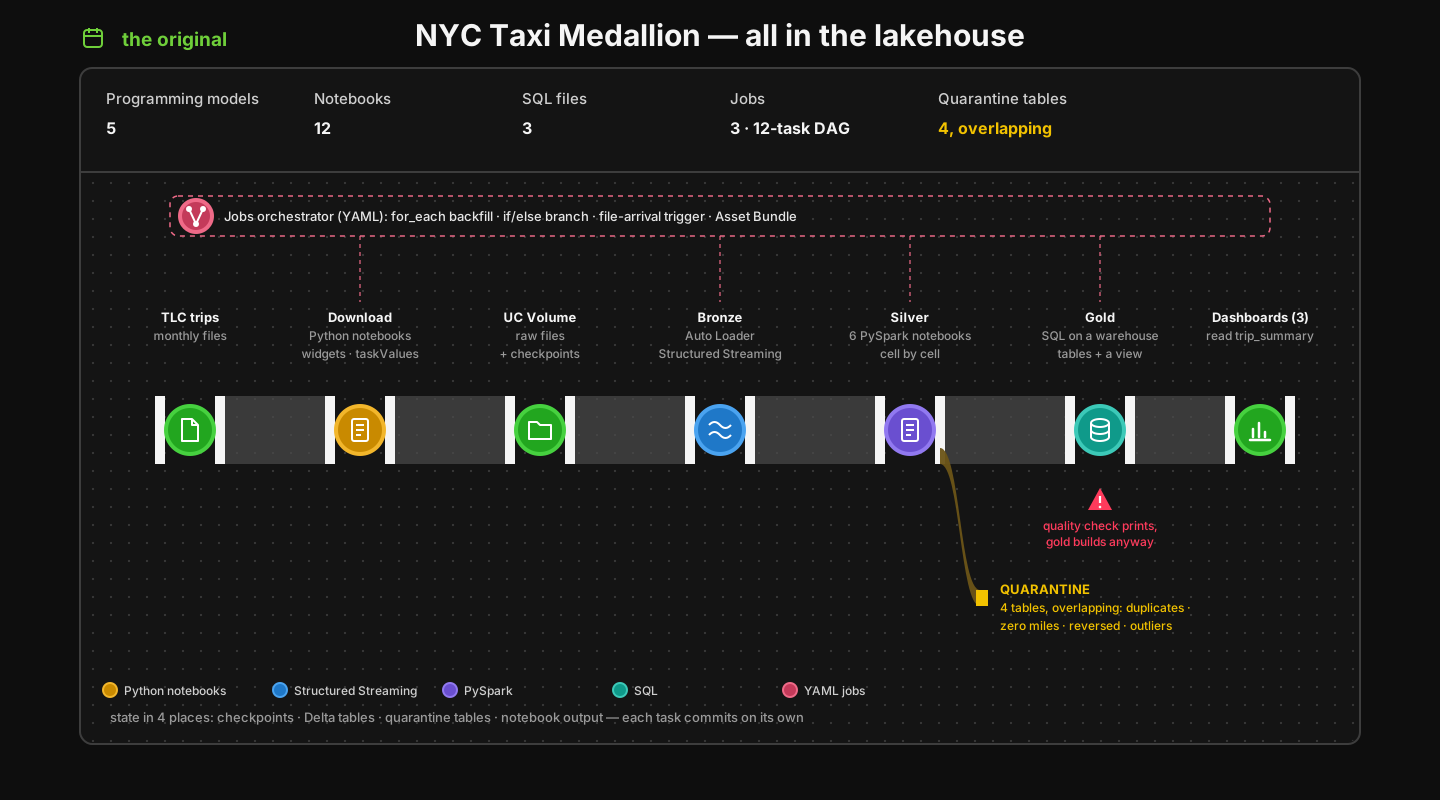
The original does everything inside the lakehouse, ingestion and prep included, and every piece asks you to think differently:
- Download: Python notebooks on job compute, parameters in widgets, results handed on through
dbutils.jobs.taskValues. - Bronze: Auto Loader, Spark Structured Streaming: triggers, micro-batches, checkpoint directories on a Volume.
- Silver: PySpark notebooks, cell by cell, quarantining, transforming, cleaning and printing a quality report.
- Gold: SQL files on a SQL warehouse; declarative, on different compute.
- The glue: YAML job graphs with a
for_eachbackfill, an if/else branch, a file-arrival trigger and a 12-task DAG, deployed as an Asset Bundle.
Five ways of thinking, and state in four places: checkpoints, Delta tables, quarantine tables, notebook output. Each task commits on its own, and the quality notebook prints its findings while gold gets built anyway.
Implementing the use case in idiomatic Databricks
Built from scratch today with Databricks' current tools, it would look quite different. One Lakeflow Declarative Pipeline for bronze, silver and gold: Auto Loader streaming tables, expectations that drop or fail rows, AUTO CDC to deduplicate, materialized views for gold. The pipeline infers its DAG from table references and manages its own checkpoints. Around it, a small job for the download and its trigger, all deployed as an Asset Bundle.
Much closer to one way of thinking. It's the fair comparison, and the one I use below; I didn't implement it for this post.
Implementing the use case in Tabsdata
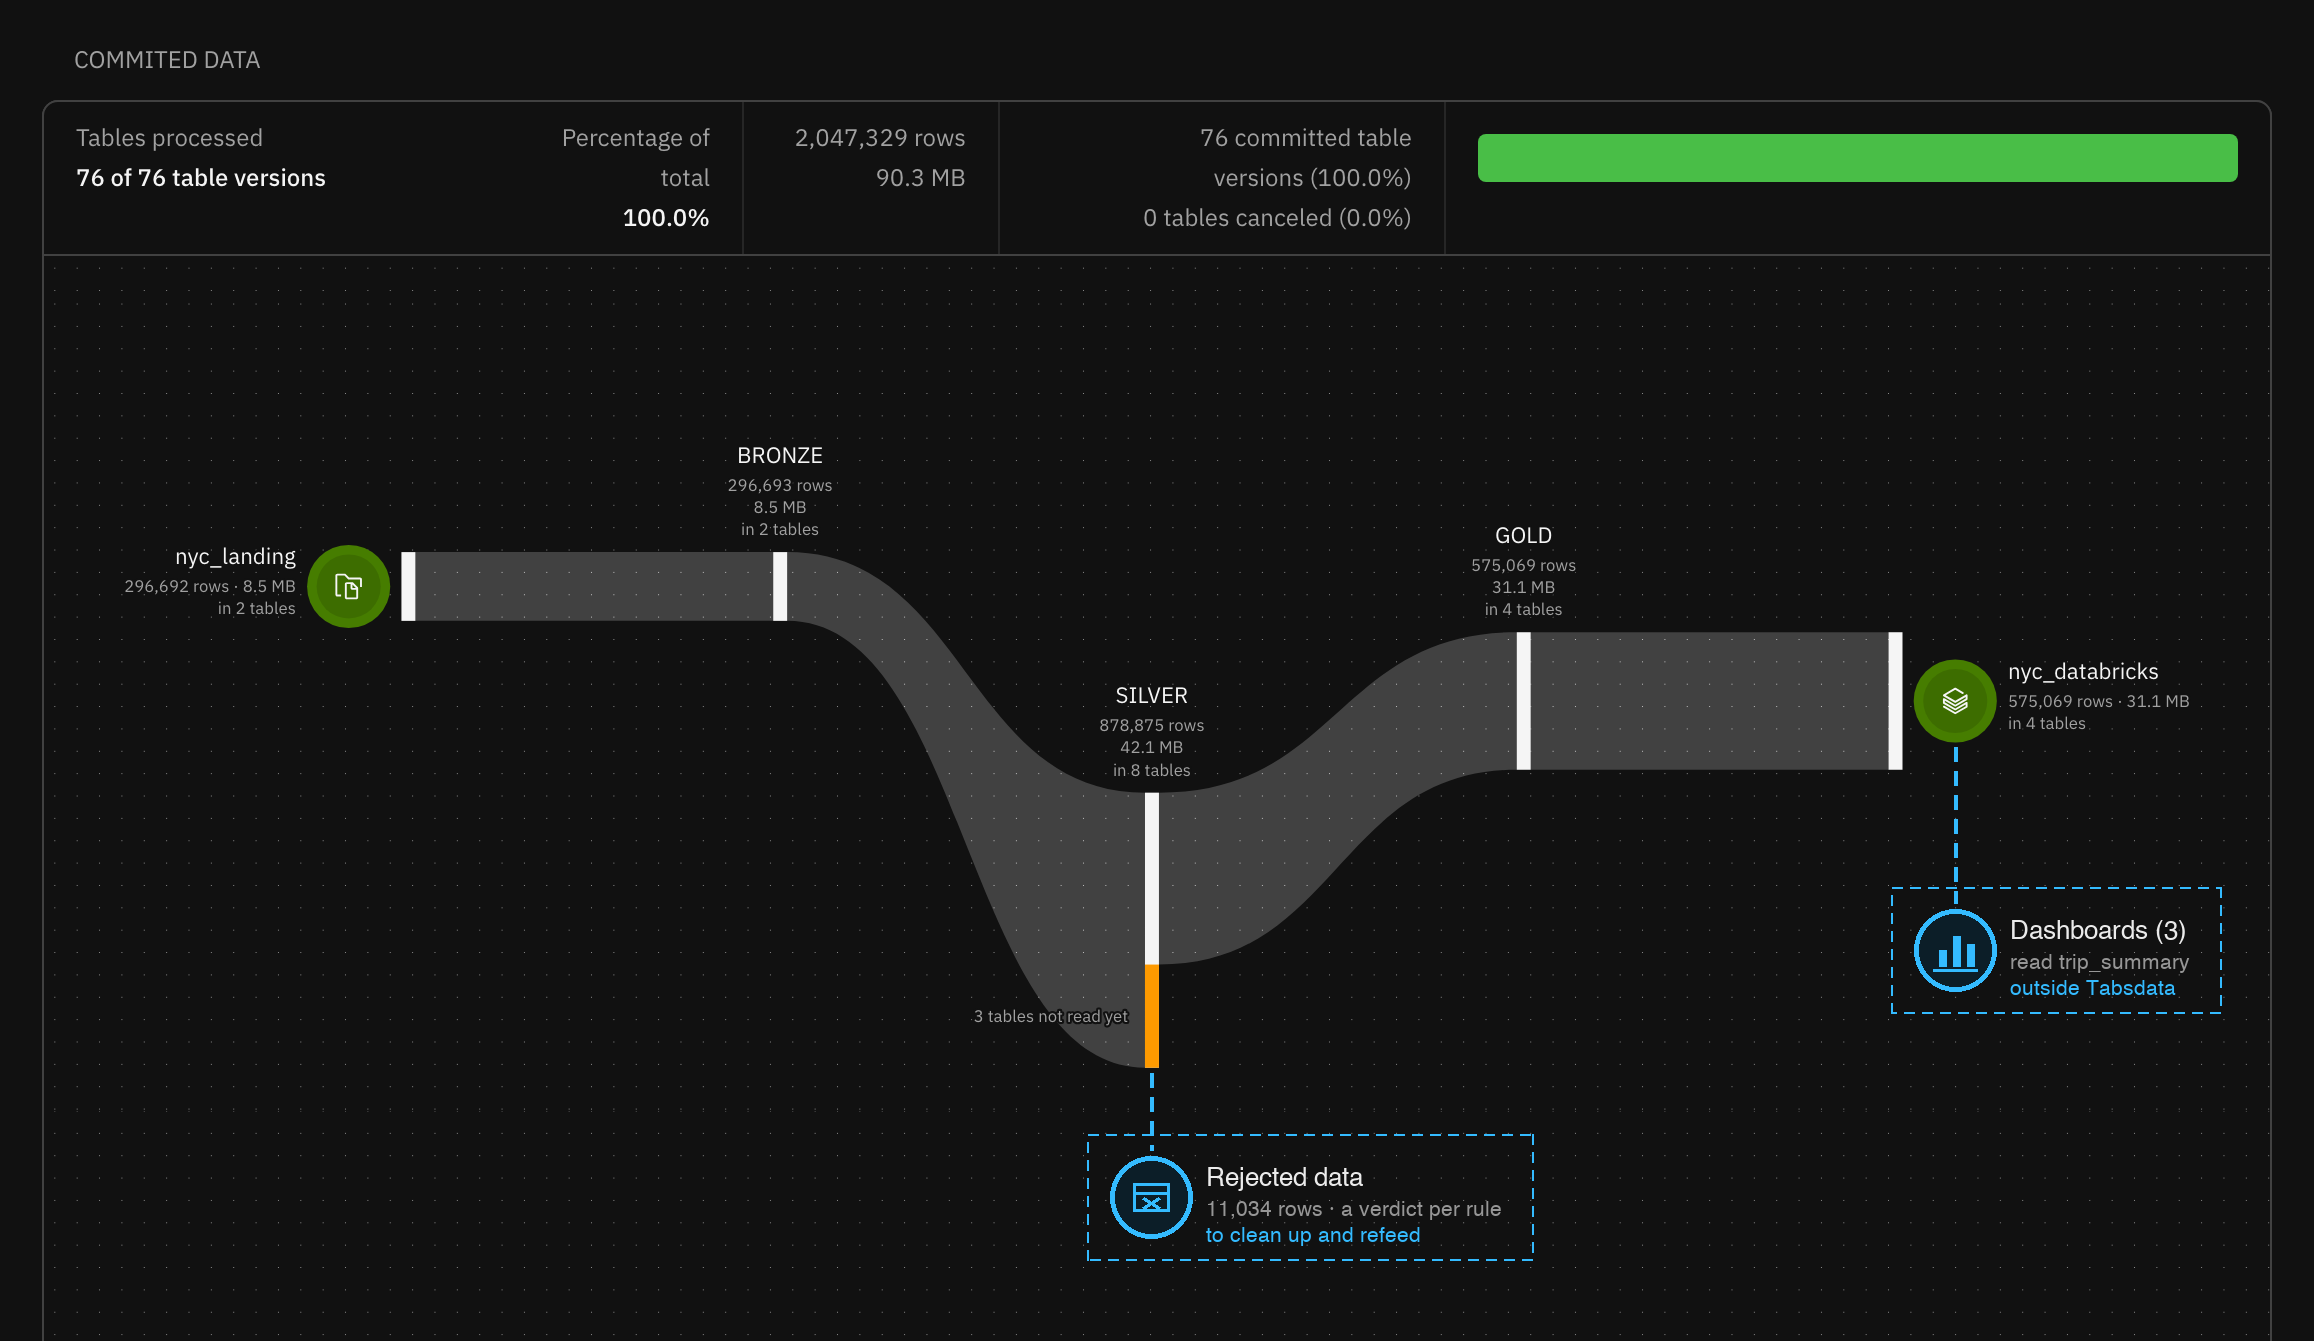
In Tabsdata there are three kinds of functions. Publishers bring data in, transformers work on data already inside, subscribers send it out. They read and write tables, and every table is immutable and versioned. That's the whole programming model. The decorator reads the way the data flows: where it comes from, then where it goes.
Ingestion, bronze, silver, gold and egress are all written this way, with the same TableFrame API, on the same runtime, and data quality is declared on the same functions. There is no orchestration file: Tabsdata works out the DAG from the table dependencies, automatically; a table is recomputed when its source data changes.
And every step is transactional: ingestion, transformation, egress. There is no way for bronze, silver and gold to end up inconsistent with each other. If something fails halfway, whatever state is left is a consistent one, never a half-written one; fix the code or the data, and the rest is computed from there.
Files land in a local directory here, for simplicity. In a real setup it would be an S3, GCS or Azure bucket; same function, different connector.
Data quality, at two levels
Incoming data quality is about the data as it arrives: is the value there, is it in range, is it what it claims to be. That is Tabsdata's native constructs, as they come. When standardizing, IsNotBetween classifiers flag passenger counts and payment and rate codes that are out of range or missing; Enrich adds those verdicts as columns without dropping a row, and the next step imputes from them.
Business-level data quality is about what the data means in this domain. A trip over 100 miles is an outlier; a negative total is a reversal; two records with the same pickup, drop-off and zones are the same trip. The constructs are the same ones; the thresholds, the business key and a couple of derived measures are domain knowledge. Tabsdata brings the first half, the domain brings the second.
Operators act on the verdicts: Filter publishes the clean rows and sends the rest to one discard table, Summary tallies every rule, and Fail aborts a batch where more than half the rows fail. A rejected row is the original row plus one verdict column per rule, so why a trip was rejected is a query, not a log line, and the row can be cleaned up and fed back.
The agent did the typing
This is the part I actually wanted to showcase. Tabsdata is AI first: it ships an MCP server with medallion skills, creation guides, the SDK reference and a code verifier, plus the tools to register, run and inspect functions on a live server. I connected it to Claude Code, pointed it at the original repository, and asked.
I didn't write the functions, or the runbook. My job was direction and taste; the agent read the original, wrote and verified the functions, registered and ran them, read the failures, fixed them, and wrote the scripts.
That's not only the agent being clever; it's also Tabsdata being built for it. Each makes the other better. The skills tell the agent how a medallion layer is done in Tabsdata, so it builds from documentation rather than vibes; a verifier checks every function before it's registered; and the MCP server lets it operate the live system, as me and with my permissions. Because every table is versioned and every function deterministic, when something breaks the agent reads what actually happened instead of guessing. Iterating was cheap. Abridged, it went like this.
First, install Tabsdata MCP in the agent and connect to Tabsdata:
Then start the agent and ask to do the port:
A corollary of the agent doing the typing: many of my corrections weren't about what the code did, but about how it reads. I wanted it to look like my own handwriting (an inside joke from my first job).
Side by side
How an idiomatic Databricks implementation and the Tabsdata one stack up, functionally:
Both are declarative; both infer a DAG. The main differences are in transactionality and in data quality. Every load in Tabsdata is a multi-table transaction, so a failure can't leave bronze, silver and gold disagreeing. And data quality results are data too: rejected rows and their verdicts are tables you query, clean up and refeed, not counters in a log (more on that in an upcoming post). The warehouse keeps what it's best at: the tables, the SQL, the dashboards.
Try it
All code for this project is available in the Tabsdata tutorials repository, in the t11_nyc_taxi_databricks directory. To access it:
The repository has the functions, a setup guide for Tabsdata and its MCP server, and a runbook. Fill in your warehouse details in usecase.json; three commands take you from TLC's files to the dashboards.
A couple of hours, not months. The dashboards didn't notice.